Should we ship this feature?

Introduction
During my time at tech companies, one of the most challenging tasks for my team has been guiding the Product team in their decision to launch a feature. This process is both highly consequential and fraught with potential pitfalls. Let's consider an example to ease into the topic:
You've worked hard to convince leadership to measure the impact of a cool new feature, and you've set up a well-designed experiment. After four weeks, you observe a statistically significant improvement in your primary metric, while secondary metrics remain neutral. The story seems clear: you should tell the team to ship it, right?
The problem with shipping features
Once the results are in, the focus often shifts to outcomes, and leadership is incentivized to ship. Consequently, the cost side of the equation receives little attention:
Tech Debt: Does this feature increase system complexity? Does it hinder long-term growth by imposing a tax on any new feature? Consider the Net Present Value of such a tax. This aspect is frequently overlooked, leaving some teams burdened with significant disadvantages, resulting in long development cycles when one could reasonably expect 2-3 times faster cycles.
Long-term Effect: Experiments measure short-term effects on a population. They do not capture behaviors that take time to materialize, such as competitors' reactions, brand effects, or customer word-of-mouth on "circumventing the feature" in cases of fraud.
False Positives: A low p-value does not address false positives. Instead, it describes the probability of observing a change as extreme as the one you are seeing under the null hypothesis. What is the probability of a false positive given your observations?
Thinking about Tech Debt
Tech debt is primarily shouldered by Engineering and sometimes by Data Science. A strong partnership with Engineering is necessary to assess it accurately. Here are a few probing questions to consider: Is the system more complex? How so? Can you help me understand your development velocity before and after? Can you quantify it? For example, if you had a single model before and this feature adds another model, training time might increase by 100%, resulting in a ~20% longer development cycle. Is the system more fragile? Do you have more interfaces, special cases, or reliance on data pipelines/APIs that may become obsolete?
Fragility is an interesting topic that is easy to underestimate. If you add three components with a 1/1000 chance of failing in a day, the probability that your system will fail at least once over a year is 66% (yes, more likely to happen than not).
Rethinking leadership incentive
At the core of this issue is incentive: a team is seen as successful if it ships features, and so is a leader of an organization. Since tech debt is difficult to quantify and gradually impacts team productivity, team leadership often disregards it.
While Data Science cannot change the incentive structure alone, it can play a significant role in highlighting these trade-offs by leveraging its institutional status as a "guide to decision making." Most leaders are reasonable and strive to do right by their team. They understand these trade-offs as long as they are presented clearly and early. Tactically, individuals at my level (DS manager) can initiate discussions by requesting an analysis before launching the experiment (by including that component in their experiment spec) and reaching a consensus with PM/Eng on shared launch criteria.
Quantifying False Discovery Rate
To address false positives, you need to dig deeper into the definitions of power and false discovery. You can write four equations with four unknown variables (TP, FP, TN, FN):
Power: Ability to detect small changes
p-value: Acceptance of False Positives (the higher, the more “accepting of FP” the experimenter is)
Ship rate: % of features shipped
SUM(TP ... FN) = 1
Leading to this matrix:

Inverting the matrix solves the problem. In particular, we are interested in FP / (FP + TP) which gives you P(FP | shipped), that is, the False Discovery Rate:
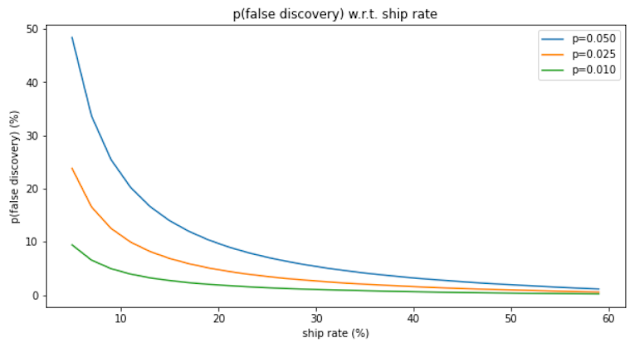
You can see that you should not be overly concerned about false discoveries unless you are conducting numerous experiments and "seeing what sticks" (a form of p-hacking). At a 50% ship rate, only 1.5% of all experiments shipped are false positives (for p=0.05), which seems reasonable. If your ship rate falls below this threshold, it may be time to recommend a lower p-value threshold.
Code: here
Good luck!