Clustering for Business People
In many situations, a business requires to simplify the customer base by excerpt some typical representatives [i.e. segments or clusters] that, put together, describe approximately the main trends within a customer base. More than any other, Marketing departments need it to understand:
- Trends (what segments are growing/shrinking)
- Customer LifeCycle (Do I recruit the same customers?)
- What are the shopping/behavioral/spending/channel habits of my customers?
- Who is the most profitable group of customers (is it a function of my Marketing Spend?)
- Where are the Marketing dollars spend? Is it a good investment
The Analytics to tackle the issue are pretty simple conceptually. Yet, it is easy to get lost between all the techniques available. Let's make a rundown on what's out there.
Overview:
| Family | Name | Description | Use | Drawback | Upside |
| Partitional Clustering | K-means K = number of clusters | For a predetermined number of clusters. find the center for each cluster that minimize distances between each point and its respective newly formed cluster | Used by marketing department in 99% of the time. | No notion of partial membership (for individuals on the border of each group for instance) Sensitive to outliers Not deterministic | Simple Intuitive technique Ease to Deploy |
| K-Medoids [1] ex:Clara | Clara is a sister version of k-means that creates medoids instead of clusters. The main difference is that Clara returns centers that are actual individuals | Used for large datasets that still fits in memory. Less common that K-means | Not deterministic | More scalable that k-means | |
| Fuzzy Clustering ex:Fanny | Similar to K-means but allows each point to be a member of several clusters | Rare. Can be useful to better account for non-obvious cases. | More complex paradigm | Better representation of reality | |
| Hierarchical | Hierarchical Clustering | Has 2 flavors: Top-down and Bottom-up. For Bottom Up: Aggregate each point with the closest one until there remains only 1 group. The output is a tree (named Dendrogram) | Can be used in Natural Sciences as it reproduces well the Species/Sub-species/Sub-Sub … paradigm. | Slow | No apriori in terms of number of clusters (one can choose the prune the tree at any height) Deterministic (run twice, same results!) |
- K-means Clustering:
Let's use the following (bogus) problem statement: We would like to design a county-level experiment to understand the effect of an implementation of a public policy on races (for instance, the very controversial No Child Left Behind policy) with the objective to be fair to everyone.
As such, we would like to ensure that we identify counties with the same racial mix. This lead to 2 questions:
1- How many different segments of counties are there?
We run a small experiment using Census data (see script) and we end up with this curve that show distinctiveness (first row) homogeneity (bottom row) performance :
2- What are their characteristics?
")
Those 2 curves show that k between 5 and 10 are good picks and achieved most of the optimal performance. I usually use this curve to select a range and then create 2-3 scenarios and see what the client feels the most comfortable with (How much is worth more granularity? Are the size of the Clusters ideal and uniform enough for your campaigns...). Depending on the use, we may choose different k).
For the sake of the argument, let's go with 6.
Here are the results:
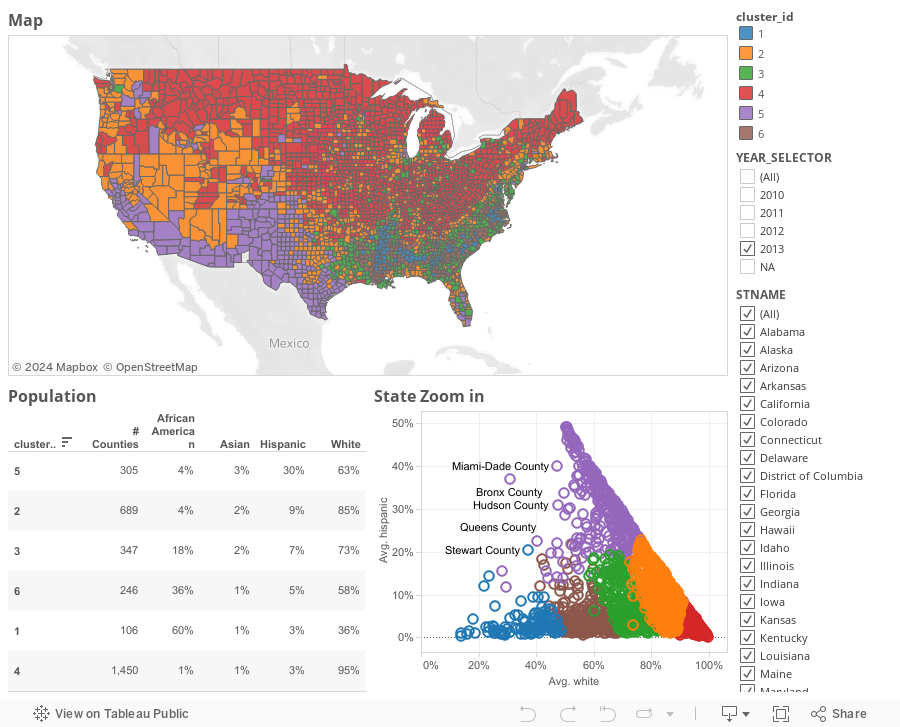
K-Means is a rigid algorithm: Once the number of clusters has been determined, it is difficult to go back. In addition, we see that they are some cases on the cluster frontier that the algorithm took the decision to put one single cluster (i.e. no sense of partial classes).
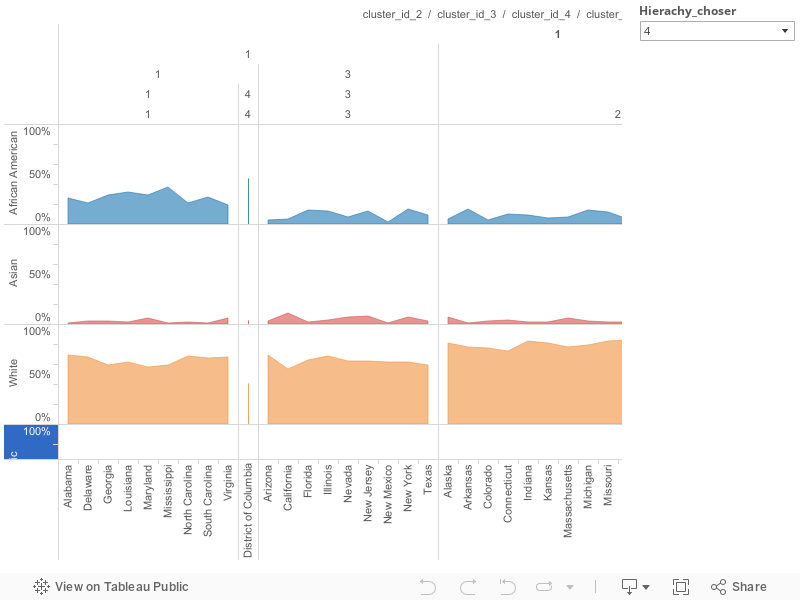
To remedy this situation, we can use a Hierarchical Clustering (only for small populations as it is expensive to compute). In our case, we want to understand how close States are in terms of racial mix.
Running a divisive clustering on the 2013 data, we would get the following:

Nice! We see that there are 4 main groups (from left to right):
1- Alabama ... Missouri: Those are the Southern States
2- Arizona ... New Mexico: Mixed bags. We will go back to it later
3- Alaska ... Ohio: Mostly Midwest States
4- Idaho ... West Virginia: Northern States
That being said, we can choose to prune (i.e. cut) at the height we want, giving that extra-flexibility that K-Means did not allow.
We also notice an outlier: Hawaii. Its population mix must be significantly different from the others (may be from natives?)
Sources:
[1] Ryan Tibshirani class deck at CMS on K-means vs. K-Medoids http://www.stat.cmu.edu/~ryantibs/datamining/lectures/04-clus1-marked.pdf Recommended Resources: Technical: R: "Cluster" package http://cran.r-project.org/web/packages/cluster/index.html Python: The must-see Scikit-Learn: http://scikit-learn.org/stable/modules/classes.html#module-sklearn.cluster Another type of clustering that evolves as more data comes it: Dirichlet Process Clustering by Edwin Chen http://blog.echen.me/2012/03/20/infinite-mixture-models-with-nonparametric-bayes-and-the-dirichlet-process/ Business: I heard good comments about this book from my colleagues: Data Science for Business: 


Very Interesting post, Guillaume!
ReplyDelete