Flight Network in Tableau
Tableau is notoriously good with tabular data but it gets frustrating to use when it comes to representing flight network, which involves spherical calculations that Tableau does not support.
 The trick is to approximate a great circle curve by a series of mini-segments. Note that the output is bigger since the data is now at the said mini-segment level.
Good luck!
PS: The data used is from Openflights. I noticed that there are errors in the dataset (such as Jet Blue flying to Dubai that is probably an codeshare-AA flight) so use with caution.
Now, say you are looking into the flight pattern of an Airline and you want give your audience a one-snapshot of the said Airline. Your center-piece will probably be a nice map of the network meshing and this is where it gets tricky: As Tableau represents flight segments as flat lines (as opposed to Great Circle lines), you end up with a mediocre visualization like the following:
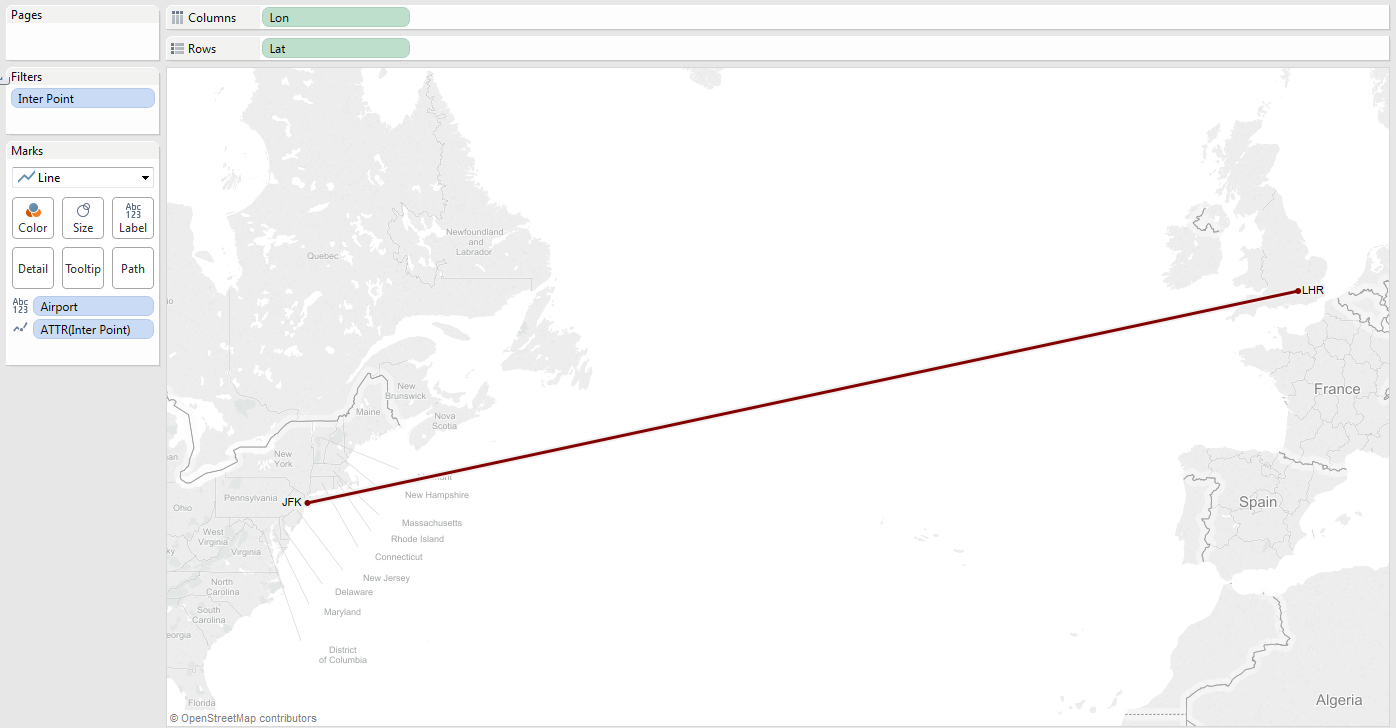 |
| JFK - LHR Flight - Straight Line |
In order to have nice curves, I resorted to pre-processing the data and calculating the intermediary points for each segment with a short Julia code snippet (available here).
I chose Julia to evaluate this new tool whose selling point is to be as fast as C and as high-level as R. If you check out my github, you will notice how familiar this language looks.
I chose Julia to evaluate this new tool whose selling point is to be as fast as C and as high-level as R. If you check out my github, you will notice how familiar this language looks.
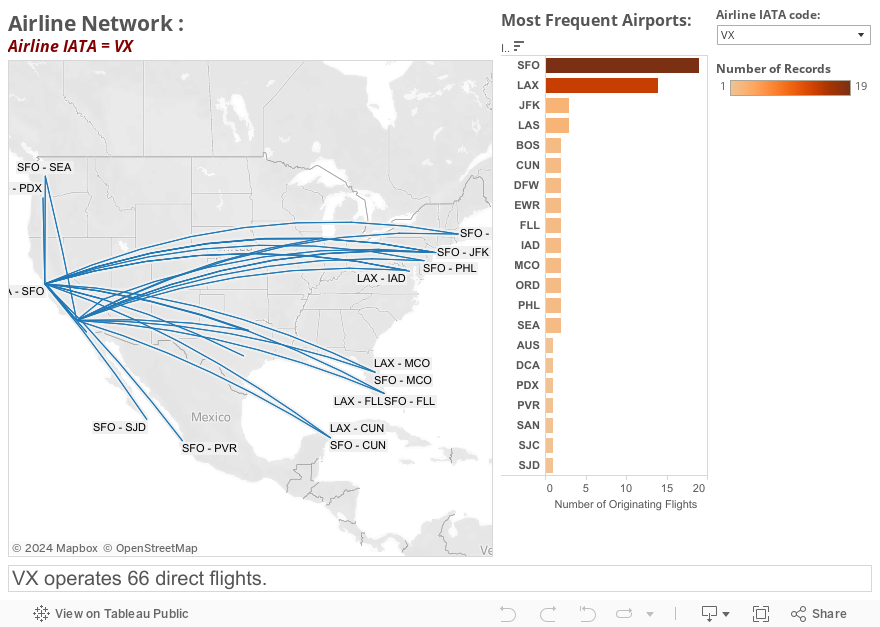
The script creates a point every 500 kilometers (~300 miles) for each flight. The final result looks like an actual flight network!
Case in point with VX (Virgin America):
Good luck!
PS: The data used is from Openflights. I noticed that there are errors in the dataset (such as Jet Blue flying to Dubai that is probably an codeshare-AA flight) so use with caution.


Comments
Post a Comment